Telemetry & Sensors
Meshtastic nodes can report sensor data across the mesh, giving you visibility into the physical environment at remote locations.
Telemetry Types
| Type | Data |
|---|---|
| Device Metrics | Battery level, battery voltage, channel utilisation, airtime fraction |
| Local Stats | Packets received/transmitted, relayed packets, duplicate packets, bad receives, node counts, noise floor |
| Environment | Temperature (°C/°F), relative humidity (%), barometric pressure (hPa) |
| Air Quality | PM1.0, PM2.5, PM10 particulate counts (µg/m³) |
| Power | Voltage and current readings from power monitoring sensors |
Device Metrics
| Icon | State | Description |
|---|---|---|
 | Full | Battery is well charged (≥80%). |
 | Low | Battery is low (≤20%) — charge the node soon. |
 | Charging | Node is plugged in and fully charged. |
 | Unknown | Battery level not reported by this node. |
 | Plugged In | Node is powered via USB/external power. |
Local Stats
Local Stats are radio diagnostics reported by the node itself. They help diagnose mesh traffic and receiver conditions with counters for received packets, transmitted packets, relayed packets, duplicate packets, bad receives, canceled packets, online nodes, total nodes, and noise floor.
Noise floor readings are shown in dBm when available. They can change quickly and should be interpreted with context: antenna direction, nearby interference, and external filters can all affect the displayed value.
Air Quality
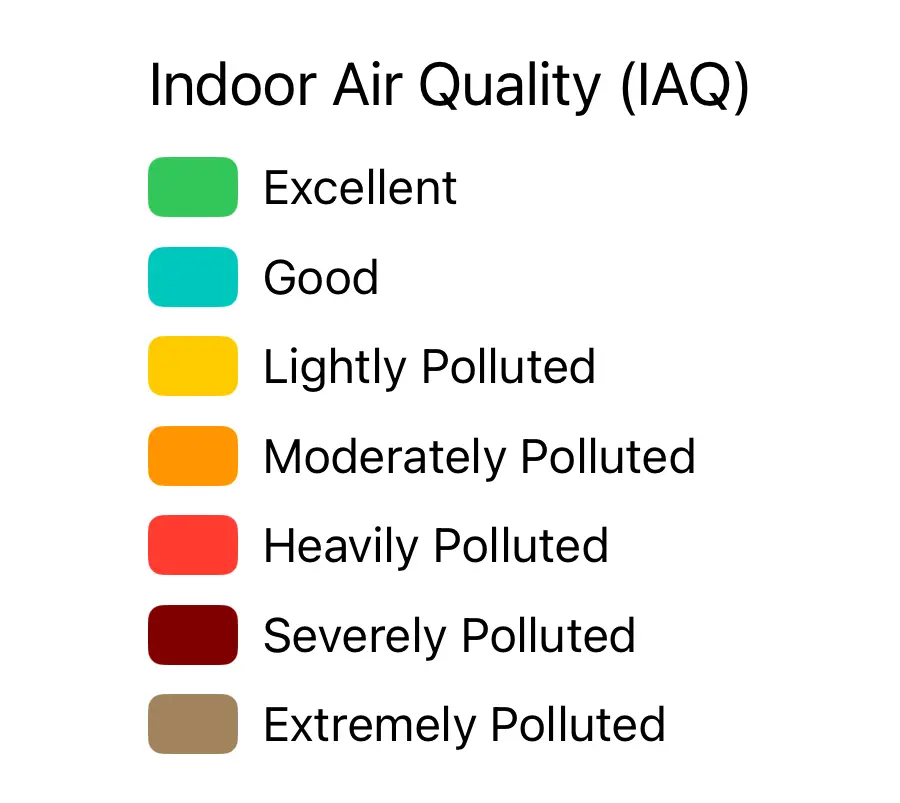
The Indoor Air Quality scale shows category bands from Excellent (green) through Hazardous (maroon). The app supports multiple display modes for air quality readings:

Environment
| Icon | Reading | Description |
|---|---|---|
 | Humidity (with dew point) | Relative humidity percentage and calculated dew point temperature. |
 | Humidity | Relative humidity percentage only. |
 | High pressure | Barometric pressure above normal (≥1013 hPa). |
 | Low pressure | Barometric pressure below normal (<1013 hPa). |
Wind
| Widget | Description |
|---|---|
 | Wind speed, gust speed, and direction. |
 | Wind speed only (no gust or direction data available). |
Radiation
| Widget | Description |
|---|---|
 | Radiation level in µR/hr from a connected Geiger counter sensor. |
Viewing Telemetry
Telemetry is visible in two places:
- Node Detail — tap any node in the Nodes tab. The Logs section shows the most recent device metrics and environment readings.
- Telemetry Charts — tap the chart icon in a node detail to see historical graphs for any telemetry type the node has reported.
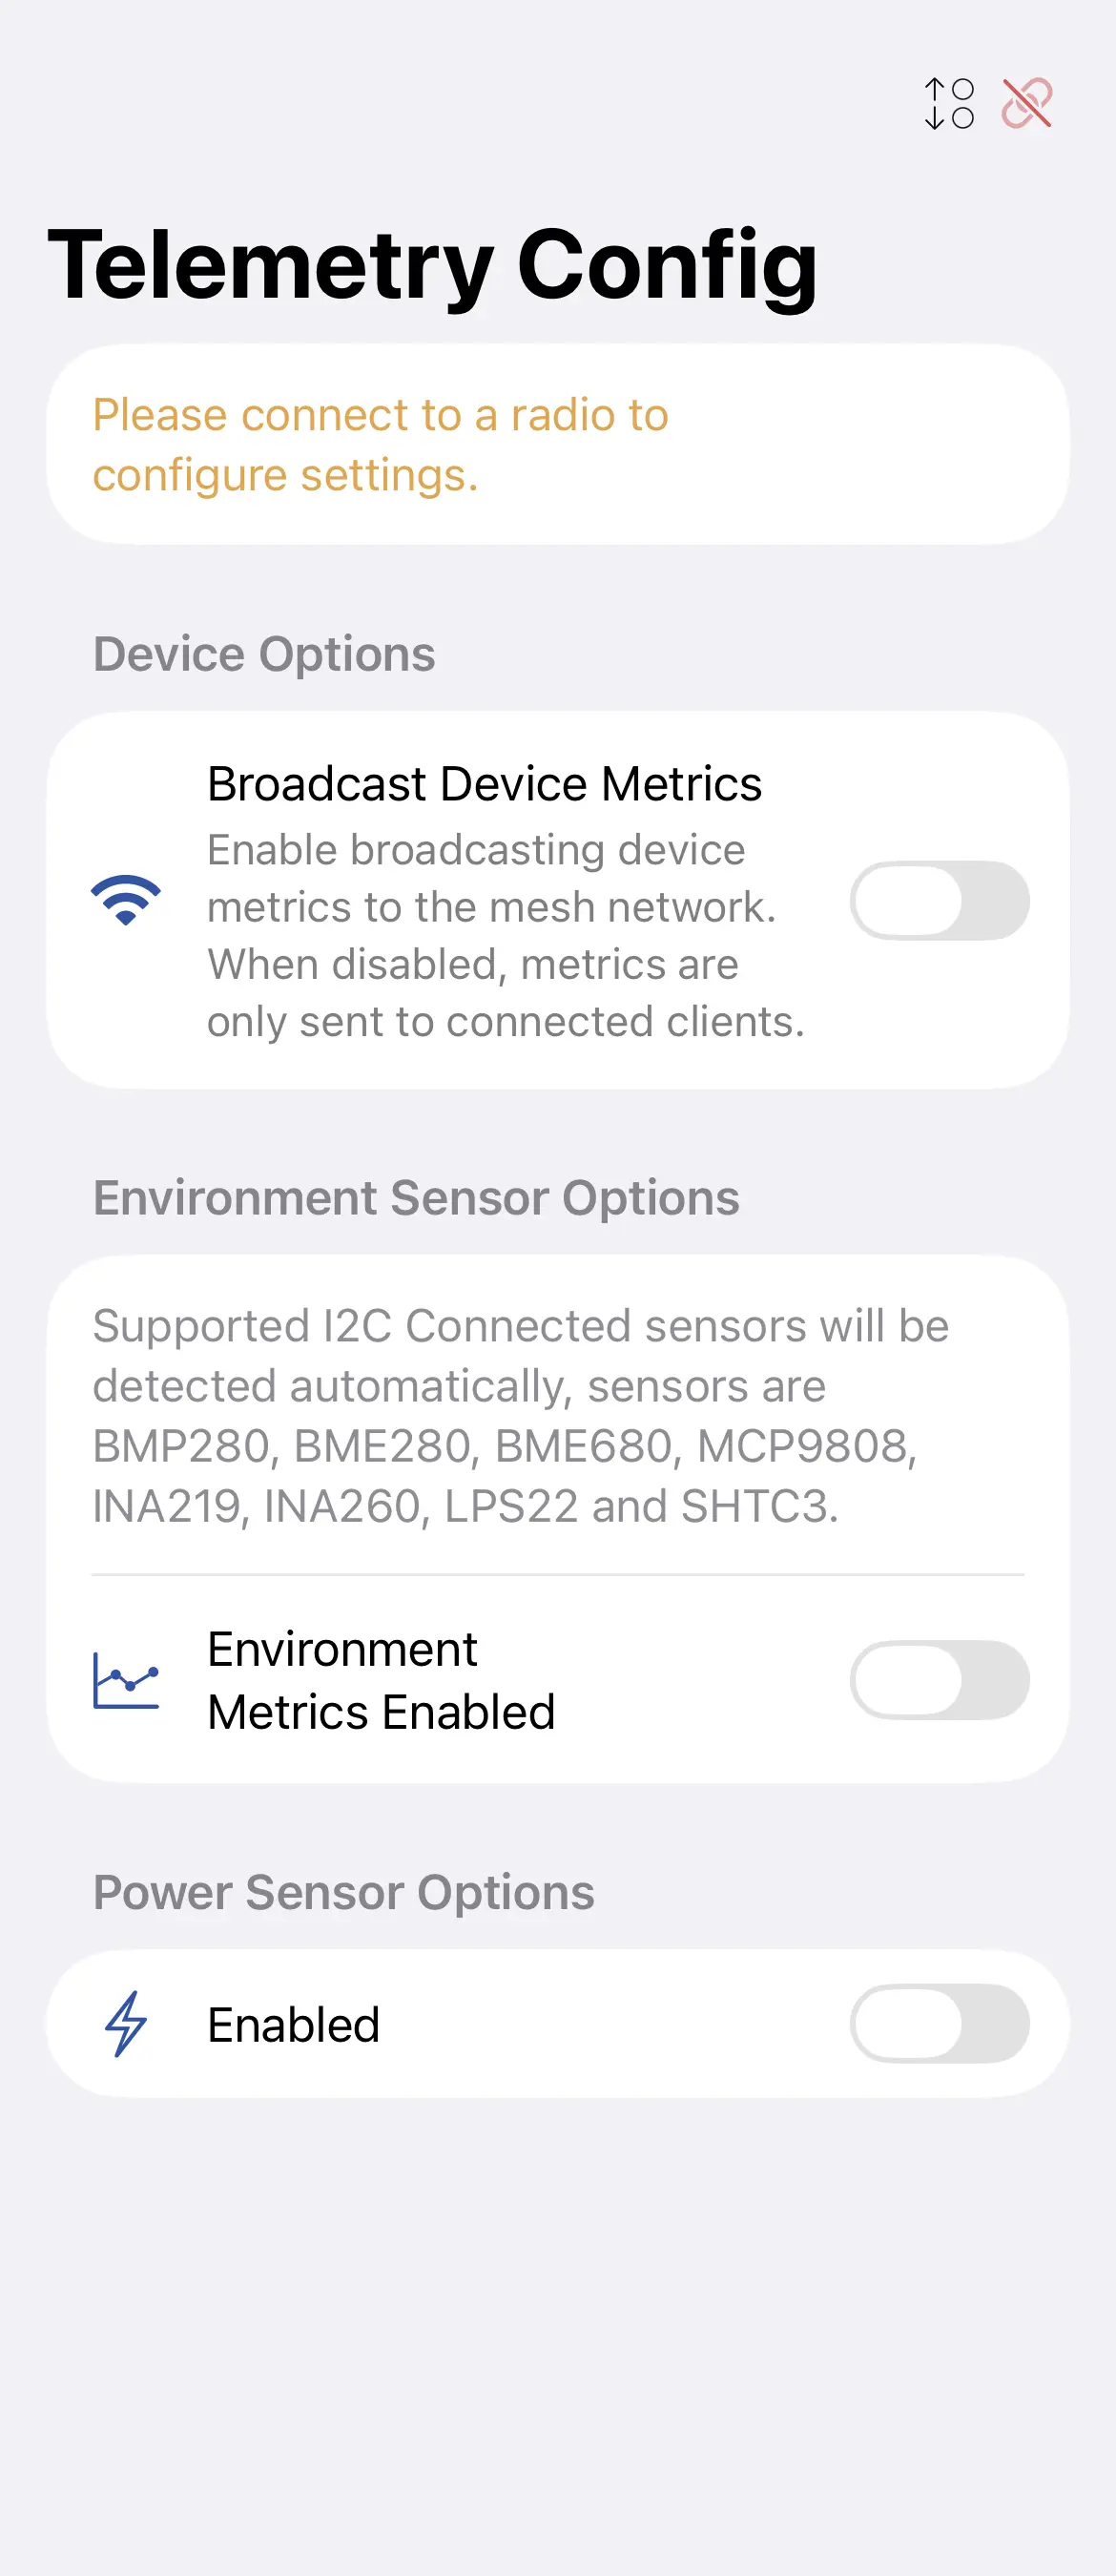
Configuring Telemetry
Go to Settings → Telemetry to enable telemetry modules and set reporting intervals:
| Setting | Description |
|---|---|
| Device Metrics Interval | How often (seconds) the node broadcasts battery and utilisation data. |
| Environment Interval | How often environment sensor data is broadcast. |
| Air Quality Metrics Enabled | Enable or disable air quality sensor reporting. When enabled, the interval picker appears. |
| Air Quality Interval | How often air quality sensor data is broadcast. Default is 30 minutes. |
| Environment Screen | Show environment data on the device screen. |
| Telemetry on Admin Channel | Restrict telemetry to the admin channel instead of broadcast. |
Supported Sensors
The app displays data from any sensor supported by Meshtastic firmware. Common sensors:
- BME280 / BME680 — temperature, humidity, pressure
- SHT31 — temperature, humidity
- MCP9808 — precision temperature
- INA219 / INA260 — power monitoring
- PMSA003 — air quality (PM2.5)
Sensor availability depends on your hardware. Check the Meshtastic hardware guide for compatibility.
Detection Sensor
The Detection Sensor module alerts the mesh when a connected PIR motion sensor or contact switch is triggered. Configure it in Settings → Detection Sensor. Alerts appear as messages on the primary channel and as node log entries.